Mitasys x EuroSchool
16 months of Search Console data · April 2025 to July 2026 · Measured clicksClicks are down 71% year on year with no recovery. Almost all of it is the blog library. The campus and locality pages that drive admissions held, and brand demand never fell.
What this updates
In July we analysed the decline using a third-party estimate, because Search Console access did not exist yet. The exports you shared let us check that work against Google's own click data. The main finding held. Five of the numbers around it did not.
| What the July analysis said | Verdict | What the measured data shows |
|---|---|---|
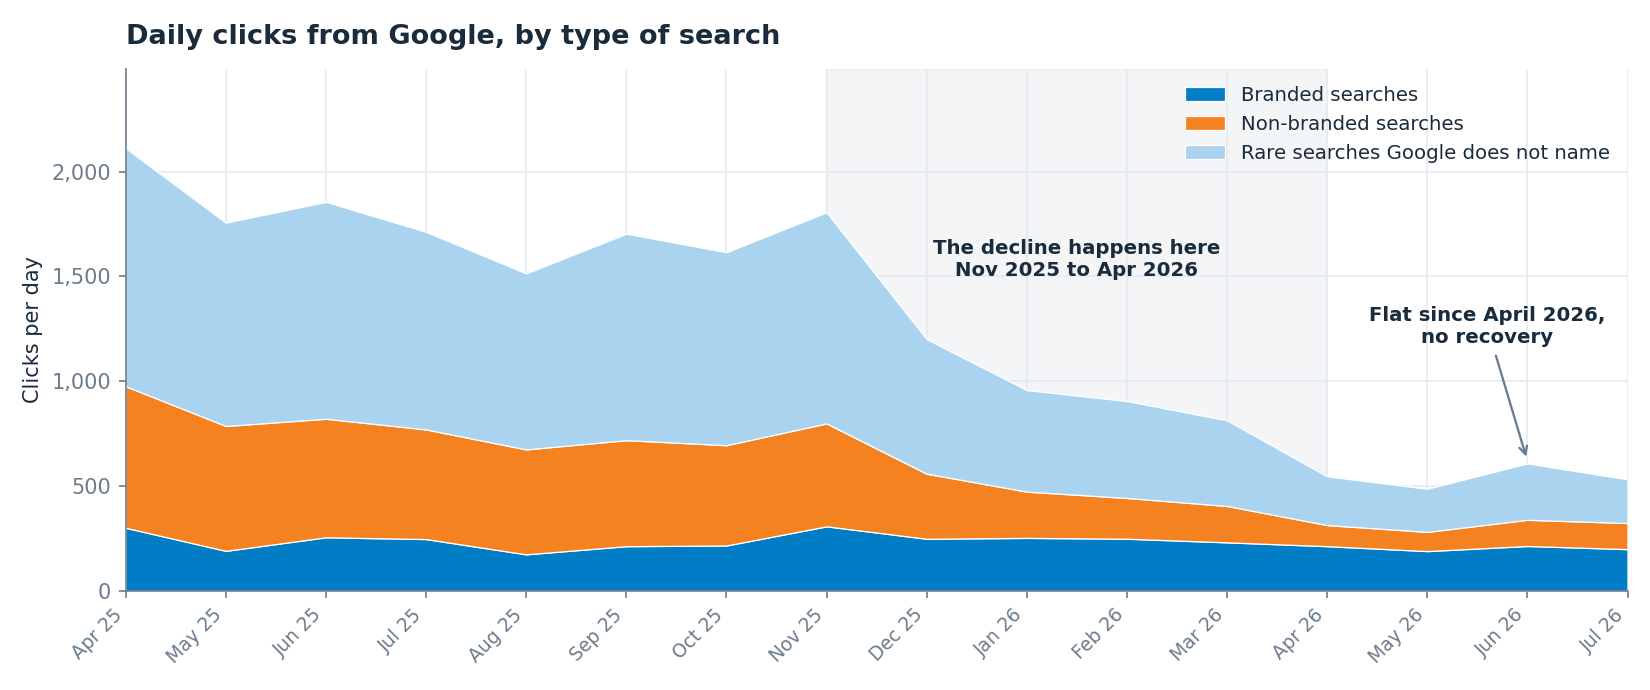
| Traffic recovered about half of the decline between May and July 2026 | Corrected | It did not. Clicks were flat at about 546 a day in April 2026 and 531 a day in July 2026. The recovery appears only in the estimate, which prices ranking position rather than clicks. |
| Traffic eroded gradually through 2025 | Corrected | Clicks held broadly steady from April to November 2025. The whole decline happened in two steps between November 2025 and April 2026, and has been flat since. |
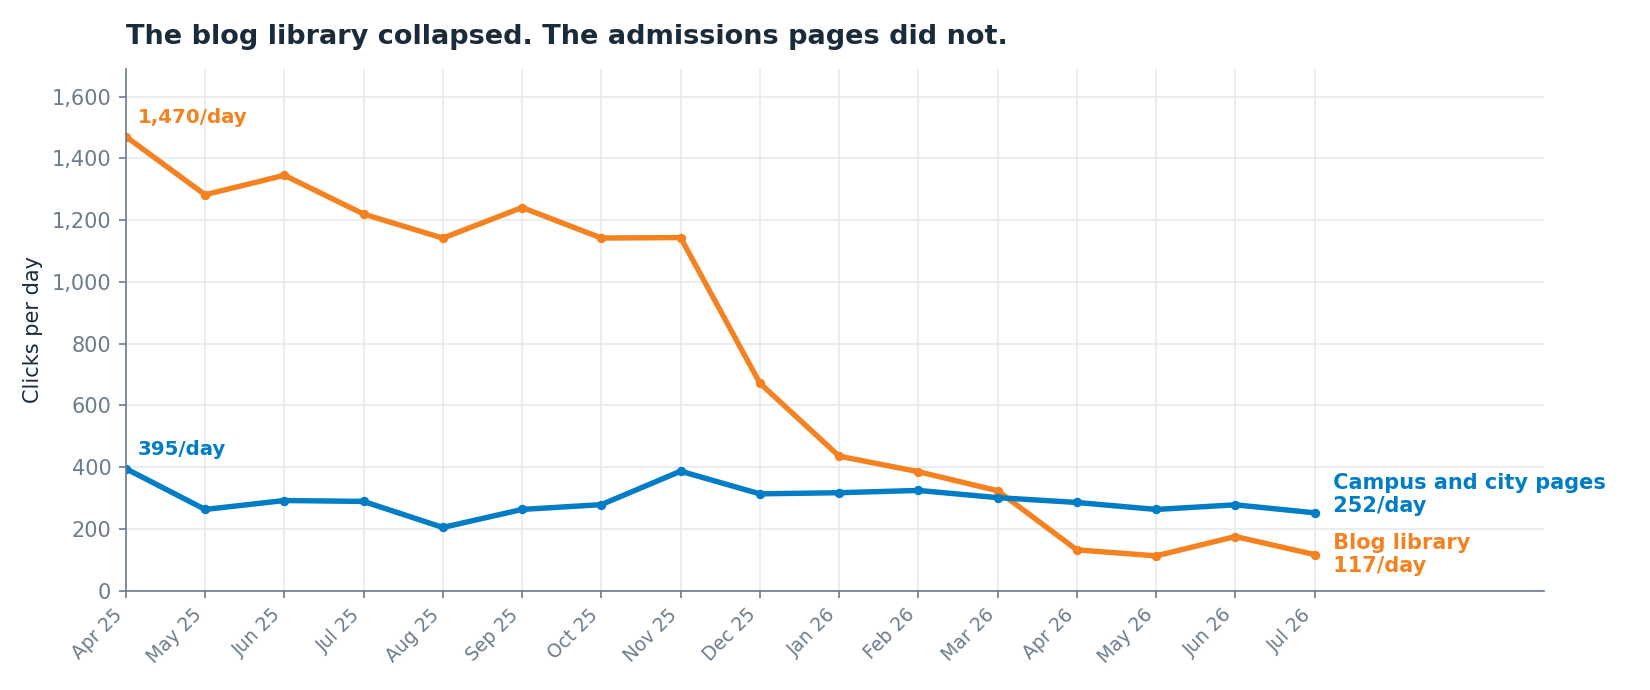
| The blog library is about 70% of the loss, campus pages about 23% | Corrected | The concentration is far sharper. Blog traffic fell 90% and accounts for 93% of the loss. Campus pages fell only 7%. |
| About 27% of the decline is branded search, probably falling brand demand | Corrected | Branded search is 3% of the loss. On a like-for-like set of 474 branded searches, the site was shown 1.7% more often than a year ago. Demand is intact; the ranking for it slipped slightly. |
| Around 80 pages appear to have been dropped from Google | Corrected | Six pages were deliberately removed and now return a permanent removal response. They alone carry 14% of the loss. Of 238 pages checked, 232 are live and serving normally. |
| Traffic fell about 61% from the January 2025 peak | Refined | Measured clicks are down 71% year on year. The decline is deeper than the estimate suggested. The January 2025 peak itself sits before the records supplied, so it cannot be checked here. |
| AI answers are intercepting clicks on informational searches | Refined | Partly. But searches where the site lost visibility outweigh searches where it held its place and lost clicks by about five to one. This is mainly a visibility problem. |
| Backlinks and seasonality are not the cause | Confirmed | Nothing in the measured data contradicts this. Comparing the same four months a year apart removes the admissions season from the picture, and the decline survives that test. |
What happened
Traffic was broadly steady from April to November 2025. It then fell in two distinct steps, between November 2025 and January 2026, and again between March and April 2026. Since April it has been flat at roughly 530 clicks a day.
Why two steps matters
A gradual slide would point at slow content decay with no single cause to find. Two sharp steps five months apart point at specific, datable events. That is a much smaller area to search.
Where it went
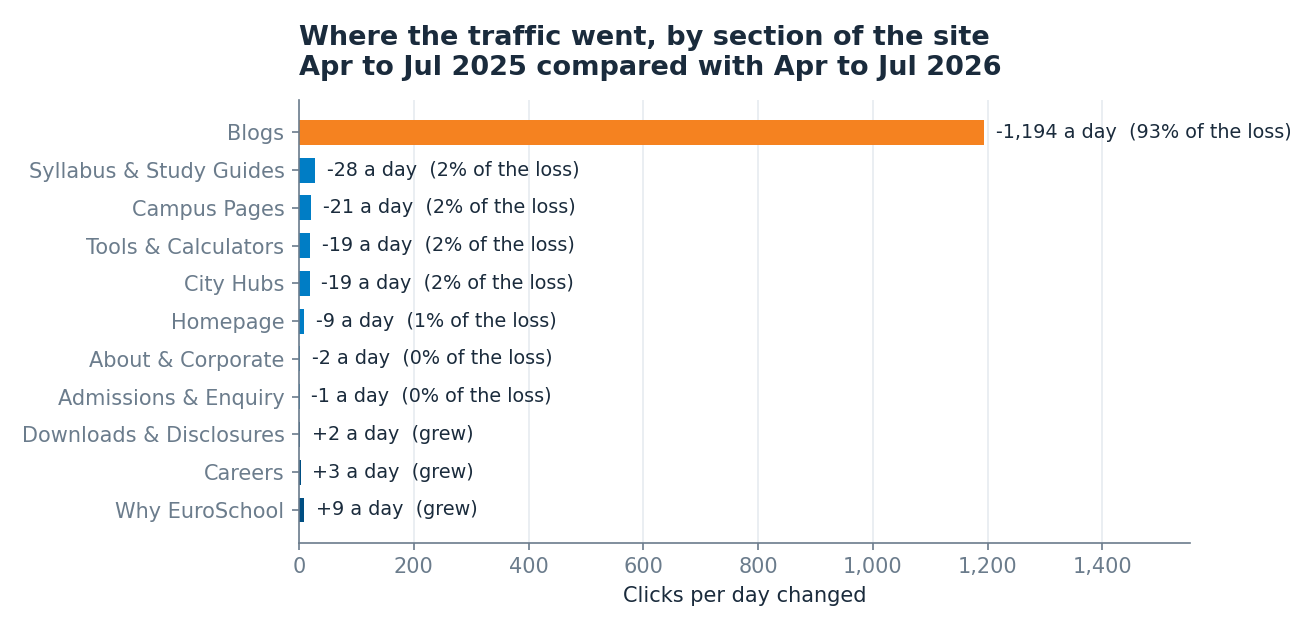
Splitting every page on the site into its section makes the shape unmistakable. One section fell away. Almost everything else either held or grew.
| Section | Clicks a day, before | Clicks a day, now | Change | Share of the loss |
|---|---|---|---|---|
| Blog library | 1,328 | 134 | -1,194 (-90%) | 93% |
| Syllabus and study guides | 39 | 11 | -28 (-72%) | 2% |
| Campus pages | 280 | 259 | -21 (-7%) | 2% |
| Calculators and converters | 20 | 1 | -19 (-94%) | 2% |
| City pages | 29 | 11 | -19 (-64%) | 2% |
| Homepage | 58 | 49 | -9 (-16%) | 1% |
| Why EuroSchool | 17 | 26 | +9 (+55%) | grew |
| Careers | 44 | 47 | +3 (+7%) | grew |
| Fee cards and disclosures | 4 | 7 | +2 (+55%) | grew |
These ten alone account for about a quarter of the site's total loss. Four of them no longer exist: they were deleted and now tell Google to remove them permanently.
| Page | Before | Now | Change | Status |
|---|---|---|---|---|
/blogs/top-60-gk-questions-for-class-4/ | 123 | 0 | -123 | Removed from the site |
/blogs/detailed-guide-on-cbse-nursery-syllabus-for-students/ | 41 | 2 | -39 | Live, not ranking |
/blogs/10-popular-inventions-and-inventors-in-the-field-of-science-and-technology/ | 37 | 0 | -37 | Live, not ranking |
/blogs/simple-gk-questions-on-sports-that-kids-should-know/ | 27 | 0 | -27 | Removed from the site |
/blogs/10-examples-of-physics-in-everyday-life/ | 38 | 14 | -24 | Live, not ranking |
/blogs/natural-resources-types-examples-importance/ | 17 | 2 | -15 | Live, not ranking |
/blogs/who-invented-zero/ | 15 | 0 | -15 | Removed from the site |
/blogs/how-many-cbse-schools-are-there-in-india/ | 17 | 2 | -15 | Live, not ranking |
/blogs/list-of-competitive-exam-for-primary-students/ | 15 | 0 | -14 | Live, not ranking |
/blogs/top-75-gk-questions-for-class-5/ | 12 | 0 | -12 | Removed from the site |
Campus pages declined gently and evenly, between 0% and 35%. An even spread like this is a mild headwind across the site, not a problem with any one campus. Gunjur, Hennur and Manjri are new and already earning searches from a standing start.
| Campus | City | Clicks a day, before | Clicks a day, now | Change |
|---|---|---|---|---|
| EuroSchool HSR Layout (ICSE) | Bengaluru | 15.0 | 17.9 | +19% |
| EuroSchool Wakad (CBSE) | Pune | 18.0 | 17.9 | 0% |
| EuroSchool Yelahanka North | Bengaluru | 15.5 | 15.1 | -2% |
| EuroSchool Wakad (ICSE) | Pune | 17.8 | 17.1 | -4% |
| EuroSchool Whitefield | Bengaluru | 31.6 | 28.6 | -10% |
| EuroSchool Electronic City | Bengaluru | 15.5 | 13.9 | -10% |
| EuroSchool Airoli (ICSE) | Navi Mumbai | 18.4 | 16.1 | -12% |
| EuroSchool Undri (ICSE) | Pune | 14.5 | 12.0 | -17% |
| EuroSchool Ghodbunder Road | Thane | 16.8 | 13.8 | -18% |
| EuroSchool Chimney Hills | Bengaluru | 11.3 | 9.0 | -20% |
| EuroSchool Bannerghatta | Bengaluru | 15.3 | 11.9 | -22% |
| EuroSchool Dombivli | Thane | 14.6 | 11.3 | -23% |
| EuroSchool Upper Thane | Thane | 5.9 | 4.3 | -26% |
| EuroSchool Balkum | Thane | 11.2 | 8.1 | -27% |
| EuroSchool Hitec City, Gachibowli | Hyderabad | 16.8 | 11.8 | -30% |
| EuroSchool Metro Campus, Kukatpally | Hyderabad | 15.7 | 10.7 | -32% |
| EuroSchool Kharadi | Pune | 23.8 | 15.4 | -35% |
| EuroSchool Hennur | Bengaluru | 0.0 | 9.0 | New |
| EuroSchool Manjri | Pune | 0.0 | 7.7 | New |
| EuroSchool Gunjur | Bengaluru | 0.0 | 5.3 | New |
Campus and locality searches
You asked which campus keywords lost their rankings. Almost none did. Taking the 79 non-branded locality searches that appear in both years, so the comparison is like for like, EuroSchool now ranks more than seven places higher and is shown more than twice as often. It still gets a third fewer clicks, because the click-through rate on those same searches fell by nearly three quarters.
The month it changed
Click-through on these searches went from 9.2% in May 2025 to 1.4% in June 2025, and has not been above 2% in any of the fourteen months since. Branded click-through held steady through that same month, at 10% to 13%, so this is not a measurement problem or a tracking change. Something altered what the results page looks like for non-branded searches. A map pack or an AI answer above the results would both produce exactly this pattern, though Search Console does not report either, so we cannot confirm which from this data alone.
Read the position column. Most of these rank better now than they did a year ago. "best school in wakad pune" went from tenth place to first and still lost 84 clicks. Only five searches in the whole set genuinely lost rank or disappeared, and they are marked below.
| Search | Clicks before | Clicks now | Position before | Position now | What happened |
|---|---|---|---|---|---|
| best schools in bangalore | 260 | 17 | 20.8 | 9.6 | Ranks better |
| best cbse school in whitefield bangalore | 220 | 0 | 13.6 | gone | Disappeared |
| cbse schools in yelahanka | 182 | 10 | 13.3 | 5.1 | Ranks better |
| best schools in kukatpally hyderabad | 181 | 5 | 9.0 | 3.3 | Ranks better |
| best schools in kharadi pune | 181 | 6 | 3.1 | 6.4 | Lost rank |
| schools in undri pune | 151 | 14 | 10.1 | 6.2 | Ranks better |
| cbse schools in hitech city | 136 | 0 | 4.4 | gone | Disappeared |
| best cbse school in kharadi | 124 | 0 | 5.4 | gone | Disappeared |
| cbse school in metro campus kukatpally | 90 | 0 | 1.0 | gone | Disappeared |
| best school in wakad pune | 86 | 2 | 10.5 | 1.0 | Ranks better |
| cbse schools in kharadi pune | 72 | 3 | 4.9 | 6.0 | Held rank |
| best icse schools in pune | 70 | 10 | 6.1 | 3.9 | Ranks better |
City-level searches are where the ranking gains did convert. EuroSchool climbed from the third page to the first on several of them.
| Search | Clicks before | Clicks now | Position before | Position now |
|---|---|---|---|---|
| schools in bangalore | 13 | 143 | 26.3 | 7.4 |
| icse schools in pune | 30 | 77 | 6.8 | 2.1 |
| bangalore schools | 0 | 51 | new | 1.8 |
| schools in pune | 3 | 50 | 33.8 | 5.1 |
| cbse schools in bangalore | 0 | 49 | new | 12.3 |
| icse schools in bangalore | 4 | 47 | 13.6 | 6.5 |
| cbse schools in electronic city | 0 | 41 | new | 3.7 |
| cbse schools in whitefield | 0 | 31 | new | 5.2 |
Six areas lost clicks and six gained. Nine of the twelve rank better than they did a year ago, including four of the six that lost clicks. The last column is the change measured on the campus pages themselves, which is a completely separate measurement: ten of the twelve agree, which is a good sign that the picture is real.
| Area | Clicks change | Position before | Position now | Campus page traffic |
|---|---|---|---|---|
| Kharadi | -313 | 4.4 | 3.0 | -53% |
| Kukatpally | -186 | 6.8 | 2.9 | -38% |
| Whitefield | -167 | 9.8 | 10.0 | -53% |
| Yelahanka | -151 | 12.4 | 4.8 | +22% |
| Undri | -104 | 6.0 | 6.3 | -12% |
| Gachibowli and Hitec City | -85 | 6.1 | 4.6 | +1% |
| HSR Layout | +40 | 7.5 | 3.2 | +287% |
| Wakad | +55 | 6.7 | 5.7 | +60% |
| Airoli | +64 | 4.2 | 4.7 | +60% |
| Bannerghatta | +103 | 5.4 | 6.3 | +76% |
| Dombivli | +128 | 6.8 | 3.7 | +39% |
| Electronic City | +152 | 13.7 | 3.5 | +323% |
The one part that did break
The city index pages are the exception. Non-branded traffic to the pages that list all schools in a city fell 93%, and Bengaluru alone went from 360 clicks to 5. Those pages sit between a parent searching and the campus they actually want, and they have stopped earning their place. Everything else in this section is about campus pages, which grew their non-branded traffic 17% over the same period.
How this was measured
Search Console reports searches and pages separately, so a search cannot be tied directly to the page it landed on. Searches were matched to an area by the words in them, then checked against what the campus pages themselves recorded. Ten of the twelve areas agree between the two, which is why we are confident in the pattern. Two do not: Yelahanka, where the searches fell but the page grew, and Gachibowli and Hitec City, which share one page. The headline uses only searches present in both years, so a change in which searches happen to be reported cannot affect it.
Why it happened
These do not overlap. Each number is a separate slice of the same decline, and together they account for essentially all of it.
Around 1,500 informational posts, mostly general-knowledge lists and school-topic explainers, lost 90% of their clicks. Of the declining pages we checked, 232 of 238 are live and serving normally, so this is Google choosing not to rank them rather than anything broken. Six of the largest were deliberately deleted and now tell Google to remove them permanently.
On a like-for-like set of 474 branded searches, the site was shown 1.7% more often than a year ago, so demand for the EuroSchool name has not fallen. What changed is the average position, from 1.98 to 2.28. At the very top of the results a third of a place is worth a lot of clicks. Something is now appearing above EuroSchool on its own name plus locality searches.
Searches from outside India fell 86% and make up more than a quarter of the headline decline. A large part of that is Google withdrawing its automatically translated results, which fell from about 6,200 clicks a month to under 300. This traffic was never going to enrol a child in Bengaluru or Pune, so it should be excluded from any recovery target.
What this is not
It is not a penalty on the whole site, and it is not the admissions pages. Campus and locality pages fell only 7% while three new campuses started earning traffic from scratch. Careers, Why EuroSchool and the fee-card downloads all grew. It is also not primarily AI answers taking the clicks: searches where the site lost visibility outweigh searches where it held its place and lost clicks by about five to one.
That balance holds for the site as a whole, because the blog library is large enough to set the totals. For campus and locality searches the reverse is true: visibility grew and it was the click-through that collapsed. The section above sets that out.
Way forward
The two largest findings both point at changes made to the site rather than anything Google did. Before we plan around them, we need to know whether they were intended.
Six blog posts now return a permanent removal signal to Google, and they account for 14% of the entire decline. One of them was the single biggest page on the site. We need to know whether that removal was intended. If it was not, it can be reversed.
About a quarter of the blog posts we sampled now declare a 2026 publish date although they were already ranking in 2025, and almost all of them still carry a lead image from 2023 or 2024. Google asks that dates reflect real updates. We need to find what produced this before deciding how to correct it.
Campus and locality pages are the part of the site closest to admissions and they came through the decline nearly intact. Three new campuses are already picking up searches. This is where added depth pays back fastest, and it is the locality-first direction we already agreed.
| Priority | Action | Why it matters |
|---|---|---|
| Must-fix | Confirm whether the six deleted pages were meant to go, and restore them if not | Six URLs carry 14% of the total decline, including the largest single page on the site. A permanent removal response is the strongest instruction you can give Google. |
| Must-fix | Find what reset the publish dates on the blog library and correct it | Roughly a quarter of sampled posts claim a 2026 publish date while their images and their traffic history say 2023 or 2024. Google's guidance is that dates should reflect genuine updates. |
| Must-fix | Win the click on locality searches, not the ranking: a complete and actively managed Google Business Profile for every campus, steady review volume, presence in the map results, and how each result itself reads in the listing | Ranking is not the constraint here. EuroSchool already climbed from position 13.4 to 6.0 on these searches and is shown twice as often, and the clicks still fell. Click-through is where the ceiling now sits. |
| Must-fix | Identify who now outranks EuroSchool on branded name plus locality searches, and win the position back | This is the branded case, and it is a genuine ranking loss: position slipped 1.98 to 2.28 while demand held. Highest-intent traffic on the site, and every place lost is recoverable. |
| Must-fix | Run a full crawl and check indexing coverage, sitemap, robots rules and canonical tags | The site is shown 63% less often than a year ago. Being found again comes before being clicked again. |
| Should-fix | Decide the future of the blog library: merge near-duplicates into fewer genuinely useful guides, put named authors and real school expertise behind them, refresh what earns it and retire the rest | The pages are live and simply not being ranked. That is a quality judgement, and the honest answer is fewer, better pages rather than more of the same. |
| Should-fix | Correct the campus pages that advertise 2026-27 in the title while their date and photograph still say 2025 | Eighteen of the twenty-five campus pages checked have this mismatch. These are the admissions pages, and the fix is quick. |
| Should-fix | Make the surviving content easy to quote: structured data, a direct answer near the top of each page, clean heading order, and access for the AI crawlers | Answer engines are a growing share of how parents research schools. This positions the content that survived rather than fighting the trend. |
| Nice-to-have | Treat the overseas and translated-results decline as out of scope | More than a quarter of the headline number, with no admissions value, and partly caused by Google retiring a feature. |
What a realistic recovery looks like
Not all of the 71% is winnable. More than a quarter of it was overseas traffic with no admissions value, and some of the informational searches now get answered inside Google. The traffic worth chasing is the Indian, parent-intent share: the campus and locality pages that already hold, the branded searches where demand never fell, and a smaller, better blog library that earns its place.
Context
Every number here comes from Google Search Console, which counts actual clicks. The July analysis used a third-party estimate because no Search Console access existed at the time.
April to July 2025 against the same four months in 2026, measured per day. That removes the admissions season and the fact that months differ in length.
More than a quarter of the decline is overseas traffic that would never lead to an admission. India on its own is down 67%, and the campus pages are down 7%.
The records supplied begin in April 2025, so the January 2025 peak referenced in the earlier analysis sits before this data and cannot be checked against it.
Next steps
Two answers unlock the two biggest items on the plan. Everything else we can begin without waiting.
Whether the six removed blog posts were meant to go, and who or what reset the publish dates across the blog library. Between them these two questions cover the largest recoverable part of the decline.
These exports carry us a long way. Direct access would add indexing coverage, any manual actions, and live weekly tracking so we can see a recovery as it happens rather than a month later.
Read the July analysis